How to debug wasm compiled by wasi-sdk?
如何调试支持wasi的wasm binary?
1. wasminspect
1.1 Wasm DWARF debug information
Before using wasminspect debug your wasm binary, you need to verify that your binary contains DWARF debug information.
The DWARF debug info for a WebAssembly file is either embedded in the WebAssembly file itself, or it is in a separate, external file. A WebAssembly file should not have both embedded DWARF and external DWARF; if this is the case, a DWARF consumer may use either DWARF debug info or it may consider the WebAssembly to lack DWARF debug info.
- Embedding DWARF info:
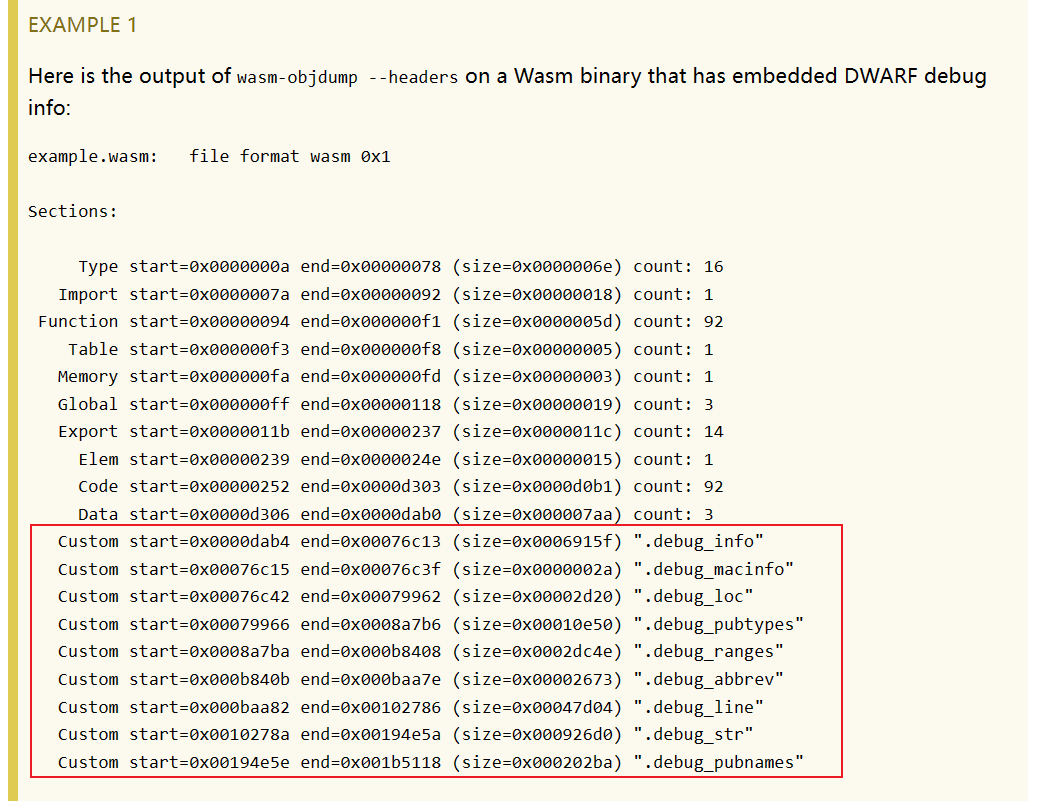
The DWARF sections are embedded in Wasm binary files as custom sections. Each custom section’s name matches the DWARF section name as defined in the DWARF standard, e.g. .debug_info or .debug_line.
You can use wasm-objdump from wabt to verify whether your wasm binary contains debug info:
- External DWARF info:
A WebAssembly file that has external DWARF contains a custom section named “external_debug_info”. The contents of the custom section contain a UTF-8 encoded URL string that points to the external DWARF file.

If the “external_debug_info” section is present, any DWARF debug info WebAssembly sections are ignored. A DWARF producer needs to remove such sections to reduce the size of the WebAssembly file. If more than one valid “external_debug_info” section is present, consumers will use the last one.
I made some attempts on Juliet test suite to get the wasm binary to contain DWARF information:
- The wasm compiled using Emscripten, although containing DWARF information, is not well recognized by wasminspect (it can’t be mapped back to the source, and can only be single-step debugged on wat);
- The binary compiled with Wasi-sdk can be successfully debugged;
BTW, you mat need to modify the Makefile in Juliet test suite and remove the pthread related files for using wasi-sdk.
1.2 Example
Locate the root cause of the discrepancy in CWE124_Buffer_Underwrite__char_alloca_loop_01_bad() between x86 and wasm.
>void CWE124_Buffer_Underwrite__char_alloca_loop_01_bad()
>{
   char * data;
   char * dataBuffer = (char *)ALLOCA(100*sizeof(char));
   memset(dataBuffer, 'A', 100-1);
   dataBuffer[100-1] = '\0';
   /* FLAW: Set data pointer to before the allocated memory buffer */
   data = dataBuffer - 8;
   {
       size_t i;
       char source[100];
       memset(source, 'C', 100-1); /* fill with 'C's */
       source[100-1] = '\0'; /* null terminate */
       /* POTENTIAL FLAW: Possibly copying data to memory before the destination buffer */
       for (i = 0; i < 100; i++)
       {
           data[i] = source[i];
       }
       /* Ensure the destination buffer is null terminated */
       data[100-1] = '\0';
       printLine(data);
   }
>}
Discrepancy:
X86 output: �R[UUU
WASM output: CCCCX
- Build wasminspect:
git clone https://github.com/kateinoigakukun/wasminspect.git
cargo build
#target tool is in ./target/debug/wasminspect
Build func
CWE124_Buffer_Underwrite__char_alloca_loop_01_bad()using wasi-sdk;Debug and check the target function:
The main difference between the above functions is that they print different characters for the same memory operation, so here you need to locate the value of data before and after it is copied.
wasminspect CWE124_Buffer_Underwrite__char_alloca_loop_01_bad-1.wasm
breakpoint set -n CWE124_Buffer_Underwrite__char_alloca_loop_01_bad
run
list
# Repeat several times
thread step-over
When the in line 30:
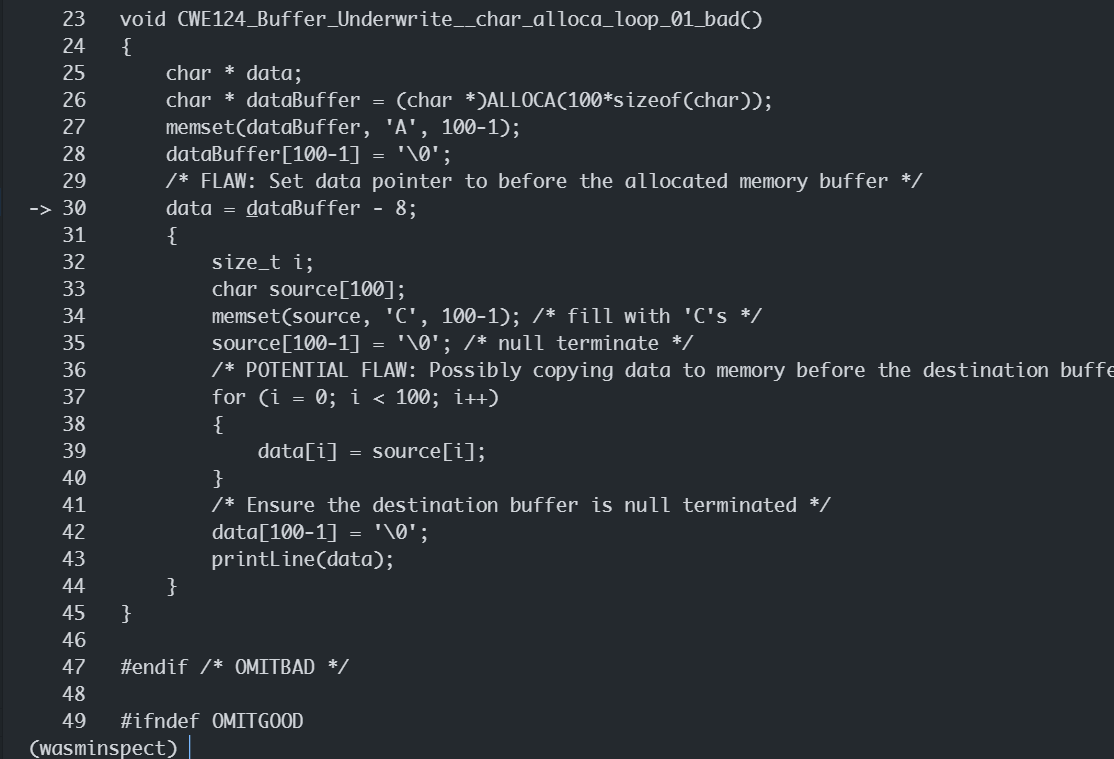
local read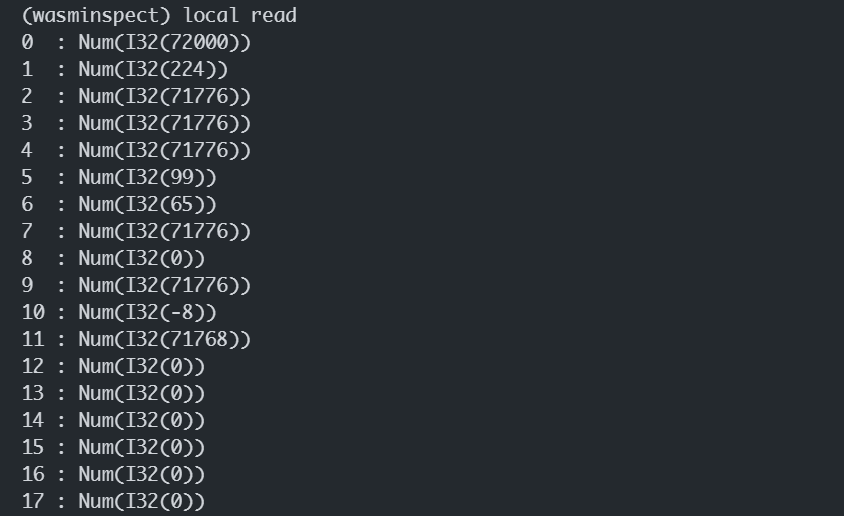
Noting that Local11 is smaller than Local9 by 8, the content of
data:memory read 71768 --count 112
The content of
source:memory read 71888 --count 112
When in line42:
breakpoint set -a  0x00000195
process continue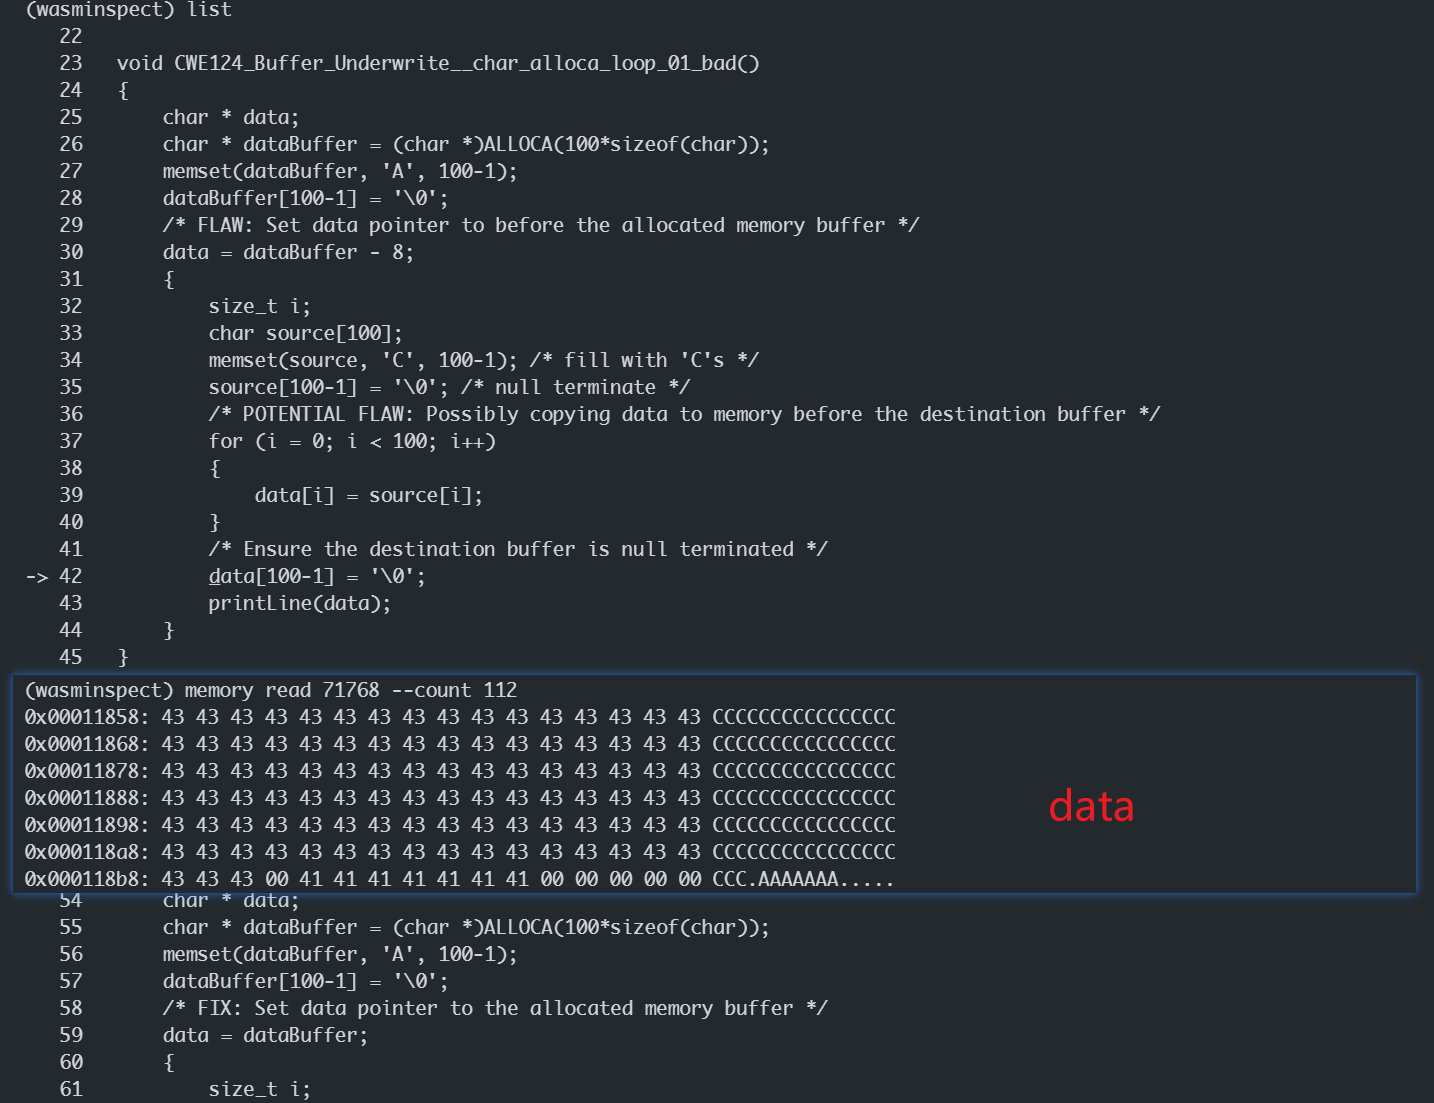
But when the program ran into the
printLine(),thedatachanged: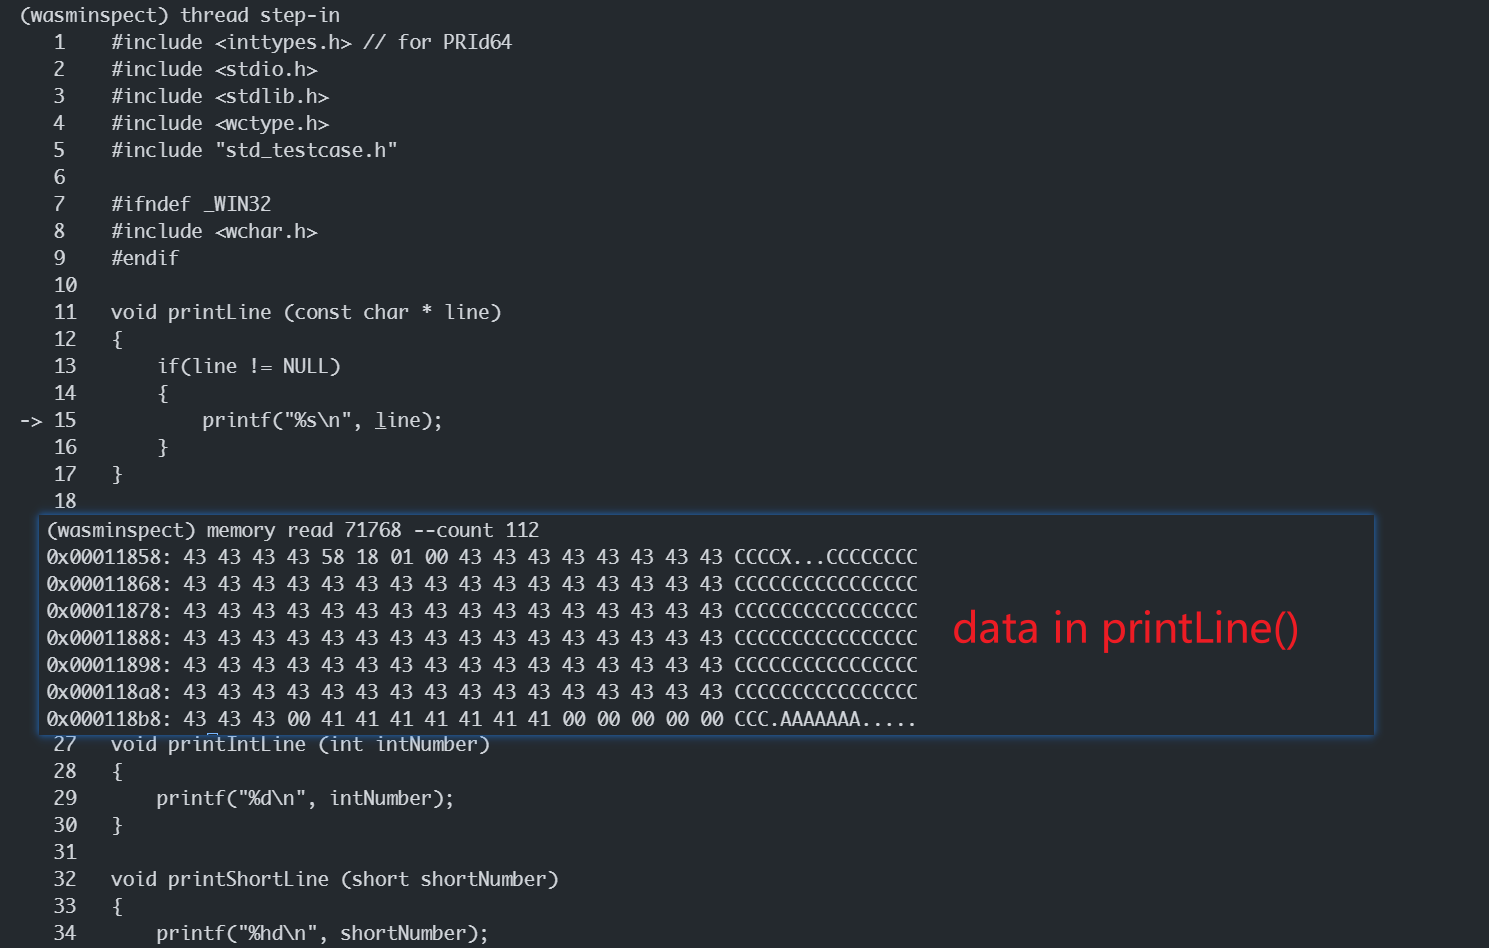

At the same address, the fifth byte of data changes to the letter ‘X’ and the 6th-8th bytes change to zero.
This may involve some manipulation during the passing of the
datapointer as an argument of printLine().
wasminspect does not support command parameters, which means u can’t debug the program requiring file input.(./program -i inputfile)
2. LLDB/GDB
With llbd/gdb and wasmtime(newest version), you can debug wasi binary just like native one:
lldb -- wasmtime run -D debug-info foo.wasm
# lldb -- wasmtime --dir /input/::./input/ -D debug-info ./tiff2pdf.wasm /input/2.1.3
gdb --args wasmtime run -D debug-info foo.wasm
With LLDB, call __vmctx.set() to set the current context before calling any dereference operators (#1482):
(lldb) p __vmctx->set()
(lldb) p *foo
Reference
- Blog:
- Documentation:
- LLDB:
